
BTC Funding Rates Today: High or Low?
Over $700 million in liquidations during July–August 2025 shows how quickly markets and funding rates change with leverage. This sharp move is key. It shows the battle between leveraged long and short traders in perpetual futures today.
I’m checking if btc funding rates being high or low means traders are mostly long or short. Funding rates swing with leverage demand. They can’t be understood alone. Looking at price movements, volatility, and big economic indicators together is essential.
Gregor Stuart Hunter from Reuters reported a new high for bitcoin at $124,480.82 before it fell. Ether also went up as the market dealt with U.S. PPI data for July being higher than expected (+0.9% m/m). This news made people think the Federal Reserve might not cut rates much, affecting both the dollar and funding rates for bitcoin and other cryptocurrencies.
Meanwhile, a Reuters report from Beijing showed China’s industrial output and retail sales growing slower. This can make investors less willing to take risks, leading to less leverage use. When traders avoid making one-way bets, funding rates often fall.
Coin World noted $429 million in liquidations in just an hour, highlighting how quick changes in volatility affect funding rates. Retail traders, who often overleverage, face a high risk of losing money. Their actions significantly impact funding rate trends.
Key Takeaways
- Funding rates are a leverage barometer: high rates usually mean crowded longs; low or negative rates often mean shorts dominate.
- Interpret funding rates today alongside price moves, volatility, and macro data like U.S. PPI and bond yields.
- Major liquidations can flip funding rates fast; recent $700M+ wipes are a clear example.
- Global growth weakness, such as slower Chinese activity, can depress crypto funding rates by reducing risk appetite.
- This article will combine real-time assessment, history, tools, and trading tactics to judge if bitcoin funding rates are high or low right now.
Understanding BTC Funding Rates Explained
I’ve noticed that funding rates have become way more important in crypto trading. Basically, funding rates are payments that long and short holders of perpetual futures trade. This helps keep the contract prices near the actual market price. If longs pay shorts, the funding is positive. If shorts pay longs, it’s negative.
Once you get the hang of it, it’s not complicated. Exchanges like Binance and Coinbase calculate funding based on certain factors. These payments are usually made every eight hours. Traders can figure out their future funding costs using tools on the exchange websites.
What are BTC funding rates?
Perpetual futures don’t expire. They stay close to the real market price through a funding process. If the future’s price is above the market, longs pay shorts, and vice versa. This exchange helps manage the price difference.
Importance in cryptocurrency trading
Funding rates tell us about the balance of leverage and what traders are thinking. When funding is consistently positive, it means a lot of people are going long. This could lead to big market moves. If funding is mostly negative, it signals that more are betting on prices falling. I use this info to decide how big my trades should be and how to protect them. It’s a crucial cost when you’re using leverage.
These rates don’t just make numbers move; they affect real market events. Extreme leverage has caused huge losses and spikes in volatility in the past. Funding rates can change quickly with the market’s mood. Big economic news, like a change in U.S. inflation, can shift money in and out of crypto. This changes funding rates on different platforms.
Knowing about funding rates helps with making smarter trades and finding opportunities between the spot and futures markets. Ignoring funding costs can hurt your profit. I keep an eye on funding rates, open interest, and liquidations. This helps me spot trouble before it starts.
Current BTC Funding Rates Overview
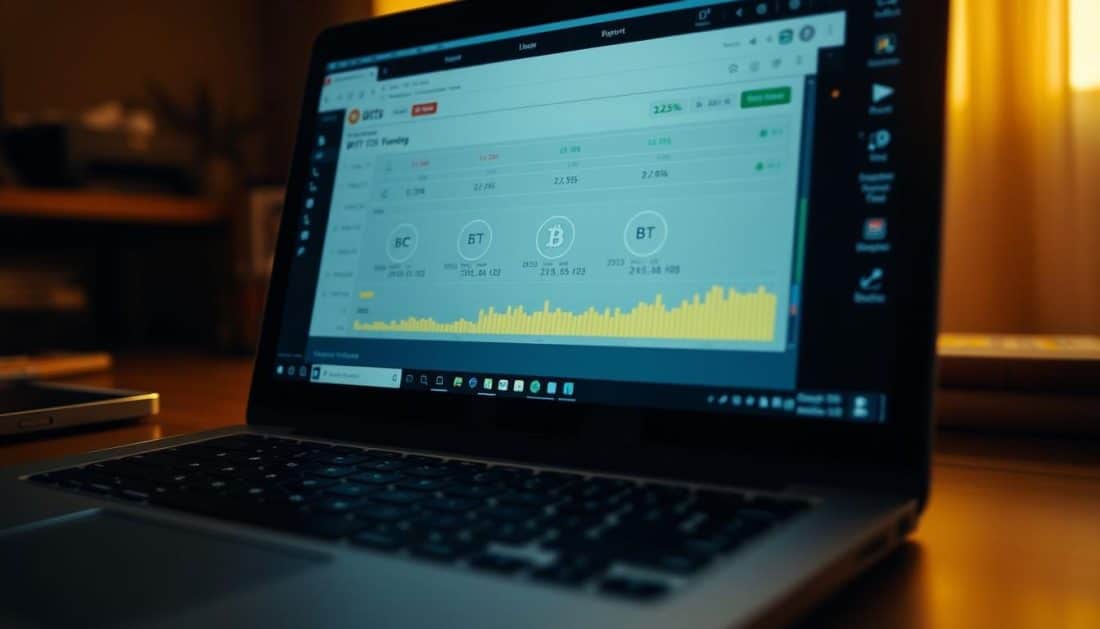
I keep an eye on funding flows through Binance, Bybit, OKX, and Deribit. This tells me how traders change their views. Below is a snapshot displaying 24-hour funding rates and BTC prices together. It also shows when 8-hour funding happens. This info helps me identify when the demand for long positions is high or when short positions take the lead.
The chart shows each exchange’s data with its own line. This makes it easy to spot the differences. High peaks suggest heavy long bets; deep troughs hint at major shorting or de-leveraging. I look at funding rates and BTC prices together. This helps me guess if a price move will continue or reverse.
Graph of Today’s BTC Funding Rates
The graph I use clearly shows a few things. These include 24-hour funding rates, BTC prices, and when 8-hour fundings happen. A quick look lets you see where money is moving. It also shows which exchange has the biggest price difference.
It’s useful to compare today’s data with past funding rates. For instance, funding rate spikes in late July to early August 2025 lined up with big market moves. Reuters reports on economic news helped show how funding changed with investor mood.
Comparative Analysis: High vs. Low Rate Days
I set limits to tell “high” from “low” days. A funding rate over 0.01% per 8 hours, or 0.03% daily, means it’s costly to keep long positions. Rates lower than this suggest it’s costly to hold shorts.
| Metric | High Rate Day | Low Rate Day |
|---|---|---|
| 8-hour funding | > 0.01% | |
| Daily implied cost | > 0.03% | |
| Likely driver | Many long positions, good news, using leverage | Long positions sold off, investors cautious |
| Exchange dispersion | Varies a lot — more spikes in retail-focused markets | Varied — big players can calm the waters |
Differences in funding often show what kinds of traders are active. Retail-heavy exchanges like Binance and Bybit have bigger swings. Institutional players might not move as much but can react quickly to big news.
Before making leveraged trades, I use a funding rates calculator. It estimates the cost over days or weeks. This helps me plan my profits and risks. Checking past funding rates shows if a current spike is unusual or part of a trend.
Historical BTC Funding Rates Analysis
I track funding metrics each month and year to find hidden patterns. I use data from exchange CSVs and sites like Kaiko and CoinGlass. This helps me divide the historical data of funding rates into monthly averages and volatility bands. It shows when bitcoin funding rates stay near zero and when they change a lot.
Monthly Trends in Funding Rates
In calm market times, funding rates usually stay close to zero. Traders either hedge or wait. This makes volatility go away, and funding becomes a neutral expense.
But in bull markets or during big sell-offs, funding rates move a lot for weeks. Long squeezes make funding go up. Quick drops make it go down. I suggest putting monthly averages and the monthly standard deviation on a plot to see these patterns.
Year-on-Year Changes
Looking at funding rates from one year to the next shows big changes. For instance, 2025 had extreme leverage and big liquidations. This made funding volatility go up compared to calmer years before. Reuters talked about when bitcoin hit a very brief high of $124,480.82 and then dropped. Events like this usually lead to high positive funding as retail investors try to buy in.
Changes in policies at big exchanges, updates to margin terms at places like Binance or Coinbase, and regulatory actions can change common behaviors over years. To track this, calculate yearly averages and how many days funding was above a certain limit. This gives a clear picture of how funding rates change year over year.
Methodology note: I get CSVs from exchanges and check them with third-party sources like Skew, Kaiko, and CoinGlass. Then, I calculate monthly averages, monthly volatility, and year-over-year differences. This helps me create a timeline of bitcoin funding rates that can be replicated.
Influencing Factors on Funding Rates
I look at funding behavior every day. I notice patterns when focusing on key factors. These include trader demand, how much money is available, large scale economic signals, and significant events. These elements affect cryptocurrency funding rates in predictable ways after you see them a few times.
Market Demand and Supply Dynamics
How much leverage people want affects who pays whom. If a lot of people want to buy long, funding increases. This means people holding long positions pay those with short ones. When more people want to sell, funding might become negative. Then, those with short positions get paid.
How deep the order book is also important. A shallow book makes prices move more. If there’s a lot of demand or supply at one price on exchanges like Binance or Coinbase Pro, a single big order can have a big impact. This can make funding rates go up or down faster than you’d think just by looking at the price.
The rules an exchange sets influence how traders act. Changing margin requirements, setting limits on leverage, or using insurance funds changes how people trade. These rules adjust how much leverage traders can use. They also change the starting point for cryptocurrency funding rates.
Impact of Major Events on Rates
Big economic news and policy expectations can indirectly affect risk assets and funding. For instance, surprises in U.S. inflation or changes in Treasury yields impact the dollar’s strength and borrowing costs. This usually makes people less willing to take risks, use less leverage, and pushes market demand funding rates toward a middle ground.
Economic slowdowns in big regions are important too. When China’s growth slows down, it reduces global willingness to take risks and lowers speculative activity. Funding that was once positive might go negative as traders pull back.
Unexpected events cause quick changes. Big sell-offs and coordinated trades force people to reduce their leverage quickly, changing funding rates in moments. These sell-offs show how quickly a market that favored long positions can switch to favoring short ones.
Behavioral trends add to technical factors. Actions like short-covering, big traders making moves, and lots of people selling at once make funding rates swing more. When a big trader makes a move, it can change funding rates in many places.
Below is a simple table that shows common factors and how they usually affect funding rates in the short term.
| Driver | Typical Short-Term Effect | Why it Moves Funding |
|---|---|---|
| Strong long inflows | Funding rises (longs pay) | Higher demand for leverage from bullish traders |
| Large liquidation event | Funding flips or spikes | Forced deleveraging and rapid order book imbalance |
| Macro downside surprise | Funding drifts lower | Lower risk appetite, reduced leverage usage |
| Exchange rule change | Funding baseline shifts | Altered leverage availability or insurance fund activity |
| Whale coordinated moves | Sharp, short-lived swings | Concentrated orders compress liquidity and trigger cascades |
Predictions for BTC Funding Rates
I watch funding across exchanges and link rates to big economic signals. Recent data made markets think the Fed might not ease its policies much. So, short-term funding rates are closely watched for surprises. I rely on several indicators like option skew, futures premium, and funding differences between exchanges to make predictions.
If riskier investments face trouble, I see funding rates calming down as traders reduce their risk. Fed’s rate predictions, changes in trading interest, and options activity are key to my short-term forecasts. A jump in Bitcoin’s price, especially if it nears $124k, could quickly raise funding rates.
Over the long haul, funding rates usually return to zero. But things like more big investors joining or new rules can change the game. These changes can make funding rates swing more often or more wildly.
I plan for different outcomes to stay ahead. If more investors join and policies get easier, funding rates could soar but might need more cash to stay up. On the flip side, tighter policies or bad news can lead to lower funding rates as traders pull back.
Records of big trade losses show that high funding often leads to price drops. It’s crucial to manage risks if the forecast shows extreme funding rates. Strategies like setting stop losses, trading smaller amounts, or using tactics to offset potential losses are vital during these times.
My approach mixes economic indicators, funding trends, and trading volume to predict funding rates. By combining Fed’s rate changes, funding speed, options behavior, and futures trends, I make useful predictions for both short and long-term funding shifts.
| Horizon | Key Drivers | Leading Indicators | Typical Funding Signal |
|---|---|---|---|
| Days–Weeks | Macro prints, risk appetite, liquidations | Options skew, futures premium, open interest | Moderation or sharp spikes depending on momentum |
| Weeks–Months | Monetary policy path, retail flows | CME FedWatch, funding divergence across exchanges | Mean-reversion with episodic extremes |
| Years | Institutional adoption, regulation, market structure | Trend in open interest, custody flows, regulatory events | Long-term mean around zero with occasional structural shifts |
Tools for Tracking BTC Funding Rates
I check funding data every morning. This helps me save time and reduce risk. Below, I’ll share the platforms I use, their importance, and a quick routine to analyze data.
Popular Platforms & Resources
Binance, Bybit, OKX, and Deribit give the latest data. They help me see differences before making a move. Sites like CoinGlass and Glassnode show funding rates and liquidations to spot market risks.
Kaiko and Skew are great for deep analysis. TradingView helps me create detailed charts across different markets. To understand market trends, I check CME FedWatch, CoinMarketCap, CoinGecko, Reuters, and Coin World.
How to Use These Tools Effectively
Start with a daily checklist. Following the same steps each day helps me stay unbiased. This way, I make disciplined choices.
- Check funding rates from Binance, Bybit, OKX, and Deribit for any unusual numbers.
- Compare these rates to the 24-hour price change and open interest using TradingView.
- Use a funding rates calculator to figure out costs based on your plan.
- Add CoinGlass or Glassnode’s data to see market stability.
- Set alerts for sudden changes in funding rates to catch important signals.
Data quality is key. Use official exchange data or trusted aggregators for accuracy. Coin World’s updates are helpful for tracking changes during big news events.
I stick to short, simple checks. This way, if funding costs and open interest signal risk, I know to be more cautious with my trades.
Frequently Asked Questions About BTC Funding Rates
I often hear the same questions from traders and curious readers. This FAQ gives you practical answers and quick rules for tracking funding. It’s meant to guide you in trades, not make decisions for you.
What Affects the Funding Rate Each Day?
The balance of leverage between longs and shorts affects daily funding on exchanges. An imbalance occurs when more buyers use margin than sellers. This creates a push and pull effect.
When open interest goes up, even small changes can make funding rates swing more. Intraday price moves also play a big role. For example, a sudden change in the Producer Price Index (PPI) can quickly change trader positions. The type of users on an exchange, like Binance versus FTX, also impacts funding. Large liquidations can cause sudden spikes in funding and prices.
How to Interpret Funding Rate Changes
Consider three things: magnitude, duration, and consistency across exchanges. Small positive funding usually means long positions are slightly leading. A high positive rate over days shows strong directional pressure and might signal a coming squeeze.
Negative funding indicates short positions are dominating. This scenario can lead to rallies if prices start to rise. A quick spike that returns to normal might just be market noise. But consistent trends that match open interest and order book depth are more telling.
Practical checklist I use:
- Compare funding across exchanges to spot outliers.
- Look at open interest trends to confirm pressure.
- Watch order-book depth for imminent squeezes.
- Factor in macro events and earnings calendars.
It’s important to understand that funding rates alone are not enough. Combine them with open interest, price action, and the overall economic picture before making a move. Extreme funding changes, like the ones in July–August 2025, show that these moments should be viewed cautiously.
Strategies for Trading With Funding Rates
I learned to treat funding as a signal, not a guarantee. It shows us market pressure and trader strategies. Consider this part a guide for using funding rates to trade wisely yet safely.
Leveraging High Funding Rates
When funding is strongly positive, big traders short perpetuals and buy spot. This strategy earns funding payments and minimizes risk. I’ve tried this on a small scale when funding was unusually high.
It’s smart to start small and estimate the profit carefully. Use a calculator to figure out your returns after costs. Expect the funding rates to stay during market squeezes. Coin World’s data warns us to be careful with timing to avoid heavy losses.
Mitigating Risks with Low Funding Rates
Negative funding means a shift in strategy. Traders can go long on spot and short on perpetuals to make a profit and stay hedged. Carry looks good when funding is low and the market is calm.
But markets can turn quickly. Always watch for sudden changes and keep extra funds ready. Set strict stop-losses to protect your trade from big losses in market shifts.
Tactical checklist
- Hedge spot exposure with opposite perpetual positions.
- Size positions so a 10–20% adverse move won’t trigger liquidation.
- Run scenario models of funding decay and fee drag before entry.
- Prefer moderate leverage and maintain margin buffers.
- Don’t chase FOMO. Retail loss statistics from brokers underscore the need for discipline.
Mixing these strategies leads to a solid plan for funding rates trading. Our goal is to profit safely. This means using hedged positions, starting conservatively, and keeping a close watch, especially when dealing with high or low funding rates.
Real-World Evidence of Funding Rates Impact
I keep track of funding signals and their effects on the market. These patterns suggest that spikes in funding often come before big market moves. This information bridges the gap between theory and real-life market actions, leading to important questions for those managing risks.
I’m sharing brief case studies and some outcome comparisons here. The point is to illustrate how funding changes can lead to liquidations, more volatility, and shifts in how traders act.
Case Studies of High Funding Rate Periods
The time between late July and early August 2025 was notable. Exchanges saw a lot of liquidations because funding rates spiked, causing forced selling. A major platform named Hyperliquid reported significant losses for traders like AguilaTrades and James Wynn during a fast market squeeze.
About $429 million was liquidated in just one hour. The total losses went beyond $700 million in that turbulent time. This situation clearly shows how high funding rates can signal and increase market instability.
When bitcoin hit a new high of $124,480.82, funding rates remained high for a while. Traders betting on price increases drove funding rates up. But when prices failed to keep climbing, the market calmed down and funding rates normalized. This pattern often happens when prices reach new highs.
Consequences of Low Funding Rates
Negative funding rates for a long time usually mean the market feels bearish and less volatile. Traders see less movement and keep betting on price drops. This calm can make them too confident about the risks.
But this calm can also mask the risk of a sudden short squeeze. If the market jumps and liquidity is low, rapid buying to cover short positions can quickly increase funding rates. This can lead to sudden market flips and big liquidations.
Data from retail CFD accounts shows that during high volatility, many traders lose money. About 81.4% of retail CFD accounts lost money on leveraged trades during major market moves. This highlights the big risks when funding rates and high leverage combine.
| Event | Funding Behavior | Immediate Impact | Quantified Losses |
|---|---|---|---|
| Late Jul–Early Aug 2025 squeeze | Sharp positive spikes, funding peaked | Forced deleveraging, rapid price moves | $429M liquidated in one hour; >$700M total |
| Bitcoin record high attempt | Sustained positive funding as longs chased price | Consolidation after resistance held | Substantial unrealized losses as longs rolled positions |
| Extended negative funding period | Persistent negative funding and compressed volatility | Lower volatility but higher short-squeeze risk | Retail CFD accounts: 81.4% loss rate near swings |
These case studies about funding rates show how imbalances in funding and leverage can greatly affect market movements. It’s important for traders and those managing risks to watch funding rates. They can be an early sign of stress in market liquidity.
Conclusion: Making Sense of BTC Funding Rates Today
I’ve looked at funding rate changes on Binance, Coinbase, and Bybit during market upsets this year. One thing is clear: funding rates tell us about leverage imbalances at exchanges, not what will happen next. Things like a surprising U.S. PPI or slower growth from China change risk feelings and funding rates fast.
The big liquidations in late July–August 2025 showed us how quickly crowded trades can fall apart. They caused huge swings in funding rates and erased over $700M in bets.
Summary of Key Findings
To understand if BTC funding rates today are high or low, look across different exchanges. Also, think about how big and long-lasting these rates are and consider the open interest. Funding rates change based on whether people want to go long or short and their willingness to pay.
Using a funding rates calculator, watching liquidation heatmaps, and keeping an eye on open interest helps. To really get funding rates, look for trends that stick around, not just sudden jumps.
Final Thoughts on Trading BTC
Based on my experience, funding rates show which trades are too crowded. But they won’t fix a trade that’s too big. See funding as both a cost and a sign of market health when trading.
Always question things, watch FedWatch for changes in rate expectations, be careful with how big your trades are, and use strategies that cover your risks. This way, by staying alert, comparing exchanges, and trading wisely, you’ll find your edge.
Sorry, the comment form is closed at this time.